Live Obd2 Data provides a real-time snapshot of your vehicle’s performance, enabling you to diagnose issues accurately and efficiently. At CAR-DIAGNOSTIC-TOOL.EDU.VN, we equip you with the knowledge and tools to interpret this data effectively, ensuring optimal vehicle health. We also offer remote support for complex repairs and technical training courses to boost your skills and confidence.
Contents
- 1. Understanding Live OBD2 Data
- 1.1 What is Live OBD2 Data?
- 1.2 Why is Live OBD2 Data Important?
- 1.3 Who Benefits from Using Live OBD2 Data?
- 2. Key Parameters to Monitor
- 2.1 Engine-Related Parameters
- 2.1.1 Engine RPM
- 2.1.2 Vehicle Speed
- 2.1.3 Engine Coolant Temperature
- 2.1.4 Engine Oil Temperature
- 2.1.5 Timing Advance for #1 Cylinder
- 2.2 Air and Fuel Parameters
- 2.2.1 Mass Air Flow (MAF) Rate
- 2.2.2 Intake Air Temperature (IAT)
- 2.2.3 Oxygen Sensor Voltage
- 2.2.4 Fuel Trim (Short Term and Long Term)
- 2.3 Throttle and Accelerator Parameters
- 2.3.1 Accelerator Pedal Position
- 2.3.2 Throttle Position (Absolute and Relative)
- 2.4 Exhaust and Emission Parameters
- 2.4.1 Exhaust Gas Temperature (EGT)
- 2.4.2 Oxygen Sensor Equivalence Ratio
- 2.4.3 Commanded EGR
- 2.5 Hybrid/EV Vehicle System Status
- 2.5.1 Hybrid Battery Pack Remaining Life
- 2.5.2 HEV Charging State
- 3. Using Live OBD2 Data for Diagnostics
- 3.1 Identifying Common Issues with Live Data
- 3.2 Step-by-Step Diagnostic Process
- 3.3 Advanced Diagnostic Techniques
- 4. Tools and Equipment
- 4.1 Types of OBD2 Scanners
- 4.2 Software and Apps
- 4.3 Essential Accessories
- 5. Benefits of Using CAR-DIAGNOSTIC-TOOL.EDU.VN
- 5.1 Access to Comprehensive Data
- 5.2 Expert Guidance and Support
- 5.3 Training and Education
- 5.4 Remote Support Services
- 6. Case Studies
- 6.1 Diagnosing a Misfire
- 6.2 Identifying a Faulty MAF Sensor
- 7. Industry Standards and Regulations
- 7.1 OBD2 Standards
- 7.2 Emissions Regulations
- 7.3 Safety Standards
- 8. The Future of OBD2 Technology
- 8.1 Enhanced Diagnostics
- 8.2 Remote Diagnostics
- 8.3 Integration with AI and Machine Learning
- 9. FAQ About Live OBD2 Data
- 9.1 What is the difference between OBD1 and OBD2?
- 9.2 How do I access live OBD2 data?
- 9.3 Can I use live data to diagnose intermittent issues?
- 9.4 What is the normal range for engine coolant temperature?
- 9.5 How can I interpret fuel trim values?
- 9.6 What is the purpose of an oxygen sensor?
- 9.7 Can I clear diagnostic trouble codes (DTCs) using an OBD2 scanner?
- 9.8 What is the role of the mass air flow (MAF) sensor?
- 9.9 How does CAR-DIAGNOSTIC-TOOL.EDU.VN help with OBD2 diagnostics?
- 9.10 Are there any safety precautions I should take when using an OBD2 scanner?
- 10. Conclusion
1. Understanding Live OBD2 Data
1.1 What is Live OBD2 Data?
Live OBD2 data, also known as parameter IDs (PIDs), provides a continuous stream of information from your vehicle’s onboard computer (ECU). This data includes critical parameters such as engine RPM, vehicle speed, coolant temperature, and fuel trim. According to the Society of Automotive Engineers (SAE), OBD2 standards require vehicles to report specific data points, ensuring consistency across different makes and models. Accessing and interpreting this data can help diagnose a wide range of automotive issues.
1.2 Why is Live OBD2 Data Important?
Live OBD2 data is essential for accurate diagnostics because it provides real-time insights into your vehicle’s operation. Unlike diagnostic trouble codes (DTCs), which only indicate a problem after it has been detected, live data allows you to observe how different systems interact under various conditions. This is particularly useful for diagnosing intermittent issues or performance problems that don’t trigger a DTC. A study by the National Institute for Automotive Service Excellence (ASE) found that using live data can reduce diagnostic time by up to 40%.
1.3 Who Benefits from Using Live OBD2 Data?
Live OBD2 data is beneficial for a wide range of users:
- DIY Enthusiasts: Home mechanics can use live data to understand their vehicle’s performance and diagnose simple issues.
- Professional Technicians: Automotive technicians rely on live data for accurate and efficient diagnostics, especially for complex problems.
- Fleet Managers: Fleet managers can monitor the performance of their vehicles in real-time, identify potential issues early, and schedule maintenance proactively.
2. Key Parameters to Monitor
2.1 Engine-Related Parameters
2.1.1 Engine RPM
Engine RPM (Revolutions Per Minute) measures how fast the engine’s crankshaft is rotating. Abnormal RPM readings can indicate issues with the engine’s performance.
- Normal Range: Varies by vehicle but typically between 600-1000 RPM at idle.
- Diagnostic Use: High RPM at idle can suggest vacuum leaks or throttle body issues. Low RPM may indicate a faulty idle air control valve.
2.1.2 Vehicle Speed
Vehicle speed is the current speed of the vehicle, as measured by the vehicle speed sensor (VSS).
- Normal Range: Matches the speedometer reading.
- Diagnostic Use: Discrepancies between the VSS reading and actual speed can indicate sensor failure or transmission problems.
2.1.3 Engine Coolant Temperature
Engine coolant temperature is measured by a coolant temperature sensor and indicates the engine’s operating temperature.
- Normal Range: Typically between 195-220°F (90-104°C).
- Diagnostic Use: Overheating can indicate a faulty thermostat, water pump, or radiator issues. Consistently low temperatures may suggest a stuck-open thermostat.
2.1.4 Engine Oil Temperature
Engine oil temperature is monitored to ensure the oil remains within its optimal working range.
- Normal Range: Varies by vehicle, often between 200-230°F (93-110°C).
- Diagnostic Use: High oil temperatures can indicate excessive engine load or inadequate cooling.
2.1.5 Timing Advance for #1 Cylinder
This parameter indicates the timing advance for the #1 cylinder, reflecting the angle of the crankshaft before the top dead center (TDC) when the cylinder should fire.
- Normal Range: Varies significantly based on engine type and operating conditions.
- Diagnostic Use: Irregular timing advance can suggest issues with the ignition system or knock sensors.
2.2 Air and Fuel Parameters
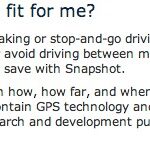
2.2.1 Mass Air Flow (MAF) Rate
The mass air flow rate measures the amount of air entering the engine.
- Normal Range: 2 to 7 g/s at idle, 15 to 25 g/s at 2500 RPM.
- Diagnostic Use: Low MAF readings can indicate a clogged air filter or a faulty MAF sensor. High readings may suggest a vacuum leak.
Alt text: Close-up of a Mass Air Flow (MAF) sensor used in automotive diagnostics, showing its components and function in measuring air intake.
2.2.2 Intake Air Temperature (IAT)
Intake air temperature measures the temperature of the air entering the engine.
- Normal Range: Close to ambient temperature.
- Diagnostic Use: High IAT readings can indicate a hot engine compartment or a faulty IAT sensor, affecting engine performance.
2.2.3 Oxygen Sensor Voltage
Oxygen sensor voltage measures the oxygen content in the exhaust gases, helping the ECU adjust the air-fuel mixture.
- Normal Range: 0.1 to 0.9V.
- Diagnostic Use: Fluctuations outside this range can indicate a faulty oxygen sensor, vacuum leaks, or fuel mixture issues.
2.2.4 Fuel Trim (Short Term and Long Term)
Fuel trim values indicate the adjustments the ECU makes to the air-fuel mixture.
- Normal Range: +/- 10%.
- Diagnostic Use: High positive values suggest a lean condition (too much air), while high negative values indicate a rich condition (too much fuel). According to a study by the EPA, fuel trim issues can significantly impact fuel efficiency and emissions.
2.3 Throttle and Accelerator Parameters
2.3.1 Accelerator Pedal Position
Accelerator pedal position indicates how far the accelerator pedal is pressed.
- Normal Range: 0% at rest, 100% at full throttle.
- Diagnostic Use: Irregular readings can indicate a faulty accelerator pedal sensor or throttle control issues.
2.3.2 Throttle Position (Absolute and Relative)
Throttle position measures the opening of the throttle plate.
- Normal Range: 0% at closed, 100% at fully open.
- Diagnostic Use: Discrepancies between commanded and actual throttle position can indicate a faulty throttle position sensor or throttle body issues.
2.4 Exhaust and Emission Parameters
2.4.1 Exhaust Gas Temperature (EGT)
Exhaust gas temperature is measured by sensors installed on the turbocharger, catalytic converter, and diesel particulate filter to prevent overheating.
- Normal Range: Varies based on the system, typically higher in turbocharged systems.
- Diagnostic Use: High EGT readings can indicate issues with the turbocharger or catalytic converter.
2.4.2 Oxygen Sensor Equivalence Ratio
Also known as the Lambda sensor, this informs the engine to adjust the fuel and air mixture in closed loop mode.
- Normal Range: Around 1.0 in closed loop mode.
- Diagnostic Use: Deviations from 1.0 can indicate fuel mixture imbalances.
2.4.3 Commanded EGR
Indicates how open the EGR (Exhaust Gas Recirculation) valve should be, as requested by the engine computer.
- Normal Range: 0% (fully closed) to 100% (fully open).
- Diagnostic Use: Abnormal values can indicate EGR valve malfunctions or issues with the EGR system.
2.5 Hybrid/EV Vehicle System Status
2.5.1 Hybrid Battery Pack Remaining Life
Displays the remaining total charge percentage in the hybrid battery pack.
- Normal Range: 0-100%.
- Diagnostic Use: Indicates the health and efficiency of the hybrid battery.
2.5.2 HEV Charging State
Shows the charging state of Hybrid Electronic Vehicle systems, such as Charge Sustaining Mode (CSM) or Charge Depletion Mode (CDM).
- Normal Range: Varies based on the vehicle’s operation mode.
- Diagnostic Use: Helps monitor the hybrid system’s performance and identify charging issues.
3. Using Live OBD2 Data for Diagnostics
3.1 Identifying Common Issues with Live Data
| Parameter | Possible Issue | Symptoms |
|---|---|---|
| Engine RPM | Vacuum leak, Idle air control valve | High or low idle, Stalling |
| Engine Coolant Temperature | Thermostat, Water pump, Radiator | Overheating, Coolant leaks |
| MAF Rate | Clogged air filter, Faulty MAF sensor, Vacuum leak | Poor acceleration, Rough idle |
| Oxygen Sensor Voltage | Faulty O2 sensor, Vacuum leaks, Fuel mixture issues | Poor fuel economy, Check engine light |
| Fuel Trim | Lean or rich condition | Poor fuel economy, Rough idle, Check engine light |
| Throttle Position | Faulty TPS, Throttle body issues | Hesitation, Stalling, Poor acceleration |
| EGR Valve | EGR valve malfunction | Rough idle, Poor performance, Check engine light |
| Hybrid Battery Life | Battery degradation | Reduced EV range, Poor hybrid system performance |
3.2 Step-by-Step Diagnostic Process
- Connect the OBD2 Scanner: Plug the scanner into the OBD2 port, usually located under the dashboard.
- Turn on the Vehicle: Start the engine and let it run.
- Access Live Data: Navigate to the live data or PIDs section on the scanner.
- Monitor Key Parameters: Select and monitor relevant parameters based on the symptoms.
- Record Data: Record the data while the vehicle is running under different conditions (idle, acceleration, cruising).
- Analyze Data: Compare the data with the normal ranges and look for anomalies.
- Diagnose the Issue: Use the data to pinpoint the source of the problem.
- Verify the Repair: After making repairs, use live data to ensure the issue is resolved.
3.3 Advanced Diagnostic Techniques
- Graphing: Use graphing features on advanced scanners to visualize data trends over time. This can help identify intermittent issues.
- Data Logging: Record data over an extended period to analyze performance under various driving conditions.
- Freeze Frame Data: Examine freeze frame data, which captures the parameter values when a DTC was triggered.
4. Tools and Equipment
4.1 Types of OBD2 Scanners
- Basic Scanners: Read and clear DTCs, display basic live data.
- Mid-Range Scanners: Offer more advanced live data, graphing, and freeze frame capabilities.
- Professional Scanners: Provide comprehensive diagnostics, bidirectional controls, and advanced functions like coding and programming.
4.2 Software and Apps
- Torque Pro: A popular Android app for reading OBD2 data.
- OBD Fusion: Available for iOS and Android, offering advanced diagnostic features.
- FORScan: Specialized software for Ford, Lincoln, and Mercury vehicles.
4.3 Essential Accessories
- OBD2 Extension Cables: For easier access to the OBD2 port.
- Bluetooth Adapters: Enable wireless connection to smartphones and tablets.
- Multimeters: For testing sensors and electrical components.
5. Benefits of Using CAR-DIAGNOSTIC-TOOL.EDU.VN
5.1 Access to Comprehensive Data
CAR-DIAGNOSTIC-TOOL.EDU.VN provides access to comprehensive OBD2 data, including standard and enhanced PIDs, giving you a complete view of your vehicle’s performance.
5.2 Expert Guidance and Support
Our team of experienced technicians offers expert guidance and support to help you interpret live data and diagnose complex issues accurately. We provide step-by-step repair instructions and troubleshooting tips to ensure you can resolve problems efficiently. Contact us via WhatsApp at +1 (641) 206-8880 for immediate assistance.
5.3 Training and Education
CAR-DIAGNOSTIC-TOOL.EDU.VN offers a range of training programs designed to enhance your diagnostic skills. Our courses cover basic and advanced OBD2 diagnostics, live data analysis, and troubleshooting techniques. We provide hands-on training and real-world case studies to ensure you gain practical experience.
5.4 Remote Support Services
For complex diagnostic issues, CAR-DIAGNOSTIC-TOOL.EDU.VN offers remote support services. Our technicians can remotely access your vehicle’s data and provide real-time guidance to help you diagnose and repair the problem. This service is particularly useful for intermittent issues or when you need expert assistance quickly.
6. Case Studies
6.1 Diagnosing a Misfire
Scenario: A vehicle experiences intermittent misfires, but no DTCs are present.
Live Data Analysis:
- Monitored engine RPM, MAF rate, oxygen sensor voltage, and fuel trim.
- Observed fluctuations in oxygen sensor voltage and fuel trim during misfires.
- Identified a vacuum leak causing a lean condition, leading to misfires.
Solution:
- Located and repaired the vacuum leak.
- Verified the repair by monitoring live data, ensuring stable oxygen sensor voltage and fuel trim.
6.2 Identifying a Faulty MAF Sensor
Scenario: A vehicle has poor acceleration and fuel economy.
Live Data Analysis:
- Monitored MAF rate and intake air temperature.
- Observed low MAF readings at high RPM and abnormal IAT readings.
- Confirmed the MAF sensor was providing inaccurate data.
Solution:
- Replaced the faulty MAF sensor.
- Verified the repair by monitoring live data, ensuring correct MAF and IAT readings.
7. Industry Standards and Regulations
7.1 OBD2 Standards
OBD2 (On-Board Diagnostics II) is a standardized system used in vehicles to monitor and report on their performance. It was mandated in the United States in 1996 and has since become a global standard. The SAE defines the standards for OBD2, ensuring consistency across different vehicle makes and models.
7.2 Emissions Regulations
OBD2 plays a crucial role in monitoring emissions and ensuring vehicles comply with environmental regulations. The EPA uses OBD2 data to assess vehicle emissions and enforce compliance with air quality standards.
7.3 Safety Standards
OBD2 data is also used to monitor safety-related systems, such as ABS and airbags. By providing real-time data on these systems, OBD2 helps identify potential safety issues and ensure vehicles meet safety standards.
8. The Future of OBD2 Technology
8.1 Enhanced Diagnostics
Future OBD systems will offer enhanced diagnostic capabilities, including more detailed data and advanced algorithms for identifying complex issues. This will enable technicians to diagnose problems more quickly and accurately.
8.2 Remote Diagnostics
Remote diagnostics will become increasingly common, allowing technicians to access vehicle data remotely and provide real-time support. This will improve efficiency and reduce downtime for vehicle owners.
8.3 Integration with AI and Machine Learning
AI and machine learning will play a significant role in analyzing OBD2 data, identifying patterns, and predicting potential issues. This will enable proactive maintenance and prevent breakdowns.
9. FAQ About Live OBD2 Data
9.1 What is the difference between OBD1 and OBD2?
OBD1 is an earlier version of on-board diagnostics that was not standardized, meaning each manufacturer had their own system. OBD2 is a standardized system mandated in the US in 1996, providing consistent data and diagnostic codes across different vehicles.
9.2 How do I access live OBD2 data?
You can access live OBD2 data using an OBD2 scanner, which plugs into the OBD2 port in your vehicle. The scanner will display real-time data from your vehicle’s computer.
9.3 Can I use live data to diagnose intermittent issues?
Yes, live data is particularly useful for diagnosing intermittent issues. By monitoring parameters over time, you can identify patterns and anomalies that may not trigger a diagnostic trouble code (DTC).
9.4 What is the normal range for engine coolant temperature?
The normal range for engine coolant temperature is typically between 195-220°F (90-104°C).
9.5 How can I interpret fuel trim values?
Fuel trim values indicate the adjustments the ECU makes to the air-fuel mixture. High positive values suggest a lean condition (too much air), while high negative values indicate a rich condition (too much fuel).
9.6 What is the purpose of an oxygen sensor?
An oxygen sensor measures the oxygen content in the exhaust gases, helping the ECU adjust the air-fuel mixture for optimal combustion and emissions control.
9.7 Can I clear diagnostic trouble codes (DTCs) using an OBD2 scanner?
Yes, most OBD2 scanners can clear diagnostic trouble codes (DTCs) after you have addressed the underlying issue.
9.8 What is the role of the mass air flow (MAF) sensor?
The mass air flow (MAF) sensor measures the amount of air entering the engine, allowing the ECU to calculate the correct amount of fuel to inject for optimal combustion.
9.9 How does CAR-DIAGNOSTIC-TOOL.EDU.VN help with OBD2 diagnostics?
CAR-DIAGNOSTIC-TOOL.EDU.VN provides access to comprehensive OBD2 data, expert guidance and support, training programs, and remote support services to help you diagnose and repair vehicle issues efficiently.
9.10 Are there any safety precautions I should take when using an OBD2 scanner?
Yes, always follow the manufacturer’s instructions and take precautions to avoid electrical shocks or damage to your vehicle’s electrical system. Do not operate the vehicle while actively using the OBD2 scanner unless necessary for data collection.
10. Conclusion
Mastering live OBD2 data is essential for anyone involved in vehicle diagnostics, from DIY enthusiasts to professional technicians. By understanding key parameters, using the right tools, and seeking expert guidance, you can accurately diagnose and resolve a wide range of automotive issues. CAR-DIAGNOSTIC-TOOL.EDU.VN is dedicated to providing you with the knowledge, tools, and support you need to excel in OBD2 diagnostics.
Ready to take your diagnostic skills to the next level? Contact CAR-DIAGNOSTIC-TOOL.EDU.VN today for expert guidance, training programs, and remote support services. Our team is here to help you diagnose and repair vehicle issues efficiently. Reach out via WhatsApp at +1 (641) 206-8880 or visit our website CAR-DIAGNOSTIC-TOOL.EDU.VN. Our office is located at 1100 Congress Ave, Austin, TX 78701, United States. Let us help you transform your approach to vehicle diagnostics and repairs.